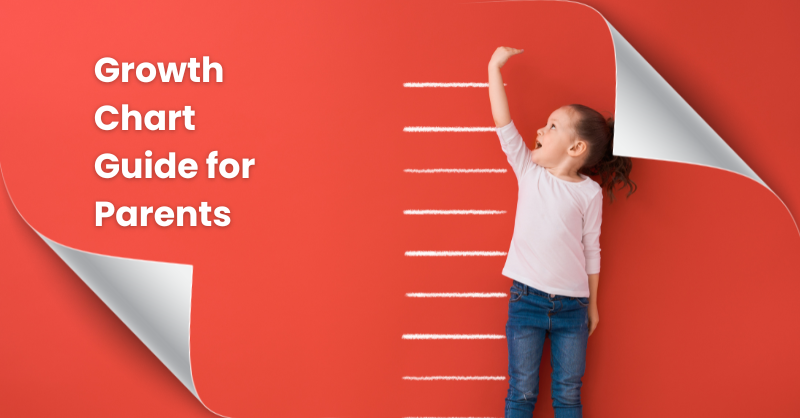
Understanding pediatric growth charts, height and weight percentiles, and what normal child growth patterns really mean for your child’s development.
As parents, one of our most common concerns is whether our children are growing properly. Are they too small? Too tall? Gaining enough weight? This comprehensive Growth Chart Guide for Parents will help you understand how to monitor your child’s development and interpret those sometimes-confusing growth charts your pediatrician uses.
Key Takeaway: Growth is not a competition. Every child follows their own unique growth trajectory based on genetics, nutrition, health, and environmental factors. This Growth Chart Guide for Parents aims to empower you with knowledge, not anxiety.
Understanding the Basics: What is a Child Growth Chart?
A growth chart is a tool that pediatricians use to compare your child’s measurements (height, weight, and head circumference) to those of a large reference population of children of the same age and sex. These charts show percentiles that help determine if a child is growing normally. Understanding how to read a growth chart is an essential skill for parents who want to actively participate in their child’s healthcare.
The most commonly used charts in the United States are the CDC growth charts, which were revised in 2006 and are based on data from national health surveys. For children from birth to 2 years, the World Health Organization (WHO) growth standards are often used internationally as they represent optimal growth under ideal conditions. This Growth Chart Guide for Parents focuses on helping you interpret both types of charts.
Decoding Growth Chart Percentiles
Percentiles are perhaps the most confusing aspect of growth charts for many parents. If your child is in the 75th percentile for height, it means they are taller than 75% of children their age and sex, and shorter than 25%. The 50th percentile represents the median or average. It’s crucial to remember that being in a lower or higher percentile doesn’t necessarily indicate a problem—consistency in growth pattern is often more important than the specific percentile.
Your pediatrician will track your child’s growth over time to ensure they follow their own curve. A significant deviation from their established pattern might warrant further investigation. This Growth Chart Guide for Parents emphasizes that while one measurement gives a snapshot, multiple measurements over time create the meaningful picture of your child’s growth journey.
Growth Chart Interpretation for Parents: What to Look For
When reviewing growth charts with your pediatrician, you should pay attention to several key factors. First, look at whether your child is following a consistent curve. Small fluctuations are normal, but dramatic jumps or drops across percentiles may signal growth issues. Second, consider the relationship between height and weight percentiles—they typically should be somewhat proportional.
This Growth Chart Guide for Parents recommends focusing on these patterns rather than obsessing over specific numbers. A child who consistently tracks at the 10th percentile for both height and weight is likely growing normally for their genetic potential. Conversely, a child whose weight percentile is significantly higher than their height percentile might need nutritional guidance.
Typical Growth Percentile Distribution in Children
This visual representation helps parents understand how percentiles distribute across a population of children.
Visual representation of growth percentiles. Most children fall between the 5th and 95th percentiles.
Age-Specific Growth Patterns in Children
Growth patterns change dramatically throughout childhood. Infants typically grow rapidly in the first year, then slow down during toddler years. School-age children have steady growth of about 2-2.5 inches per year until the preadolescent growth spurt. Adolescents experience significant growth spurts that vary in timing between teenage boys and teenage girls.
This Growth Chart Guide for Parents breaks down what to expect at different stages:
| Age Group | Expected Height Gain | Expected Weight Gain | Key Milestones |
|---|---|---|---|
| Infants (0-12 months) | 10 inches (25 cm) first year | Triple birth weight by 1 year | Rapid growth, especially first 6 months |
| Toddlers (1-3 years) | 4-5 inches (10-12 cm) per year | 4-5 pounds (2 kg) per year | Growth slows, appetite may decrease |
| Preschool (3-5 years) | 2-3 inches (5-7.5 cm) per year | 4-5 pounds (2 kg) per year | Steady growth, more proportional |
| School Age (6-12 years) | 2-2.5 inches (5-6 cm) per year | 5-7 pounds (2.5-3 kg) per year | Consistent growth before puberty |
| Adolescents (12-18 years) | Puberty growth spurt: 3-4 inches/year | Varies widely during puberty | Growth spurts, sexual maturation |
When to Be Concerned: Signs of Growth Issues
While most children grow at their own pace, certain patterns may indicate potential problems. This Growth Chart Guide for Parents highlights red flags that warrant discussion with your pediatrician:
- Crossing percentile lines: Dropping or rising more than two major percentile lines on the growth chart
- Extreme percentiles: Consistently below the 5th or above the 95th percentile
- Disproportion: Significant disparity between height and weight percentiles
- Growth cessation: No measurable growth over 6-12 months in a growing child
- Developmental delays: Late achievement of motor or social milestones alongside growth concerns
If you notice any of these signs, don’t panic. Schedule an appointment with your pediatrician to discuss your concerns. Many apparent growth issues turn out to be normal variations or temporary slowdowns.
Monitoring Child Growth at Home: Practical Tips
While professional measurements are most accurate, you can monitor growth at home between checkups. Use the same measuring technique each time, measure at consistent times of day, and record measurements in a dedicated growth log. This Growth Chart Guide for Parents recommends focusing on trends rather than individual measurements, as home measurements often have slight variations.
Remember that growth isn’t always linear. Children often experience growth spurts followed by plateaus. Seasonal variations can also occur, with many children growing faster in spring and summer than in fall and winter.
Growth Chart Percentiles 2026: What’s New?

As we move into 2026, growth charts continue to evolve with new research and population data. Recent updates have placed greater emphasis on distinguishing between healthy weight and excess adiposity in children. The latest growth chart percentiles 2026 incorporate more diverse genetic and ethnic backgrounds to better represent today’s multicultural societies.
This updated Growth Chart Guide for Parents reflects these changes, helping you understand how modern growth charts differ from older versions you might remember from your own childhood. Digital growth chart tools have also become more sophisticated, allowing for more precise tracking and prediction of growth patterns.
Additional Resources and Outbound Links
For more detailed information about child growth and development, consider these authoritative resources:
- CDC Growth Charts – Official growth charts and resources from the Centers for Disease Control
- WHO Child Growth Standards – International standards for child growth
- HealthyChildren.org – American Academy of Pediatrics parent resource
- MedlinePlus Child Development – NIH resource on developmental milestones
Conclusion: Empowering Parents with Growth Knowledge
Understanding your child’s growth patterns is an important part of parenting, but it shouldn’t become a source of constant worry. This comprehensive Growth Chart Guide for Parents aims to provide you with the knowledge to have informed conversations with your pediatrician about your child’s development.
Remember that growth charts are screening tools, not diagnostic instruments. They help identify children who might need further evaluation, but they don’t tell the whole story of your child’s health and development. Genetics, nutrition, overall health, and environmental factors all play crucial roles in how your child grows.
Use this Growth Chart Guide for Parents as a reference, but always consult with your pediatrician about specific concerns regarding your child’s growth. With the right information and support, you can confidently navigate the journey of monitoring your child’s development and ensure they’re on a healthy growth trajectory.
© 2026 Pediatric Health Resources. This information is for educational purposes only and is not a substitute for professional medical advice.